2017.1 (April 7, 2017)
Welcome to the 2017.1 release of iDev Studio. There are a number of updates in this version that we hope you will like, some of the key highlights include:
- iDev Studio has got a new IDE with Microsoft Office inspired UI experience.
- Business Glossary has got a major update. A new simple interface helps to create and manage a common business vocabulary.
- Data Mapping has got a major update. Visual data mapping technology, new data catalog and expression editor give you unprecedented data mapping capabilities.
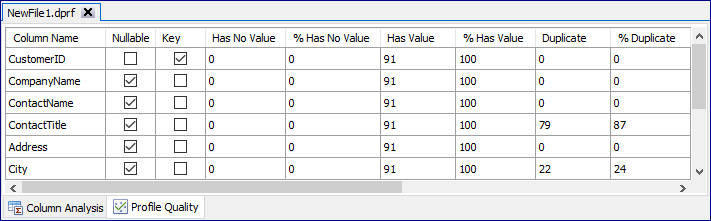
- Data profiling has got a major update. New data quality figures enable you to measure data quality.
For the latest news, updates, and content, follow iDev Studio on Twitter @iDev_Studio!
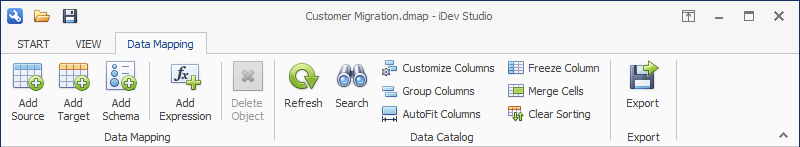
New iDev Studio IDE
iDev Studio delivers a new IDE with Microsoft Office inspired UI experience. A quick access toolbar allows to have the most used functions always at hand. Unicode support ensures that anyone in the world can use data management. Send feedback feature allows you to provide valuable feedback.
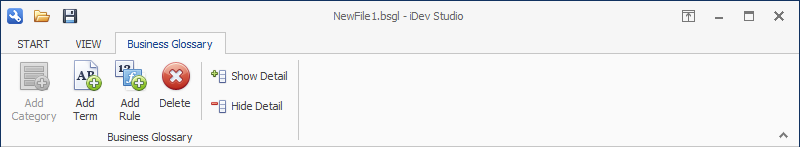
Business Glossary
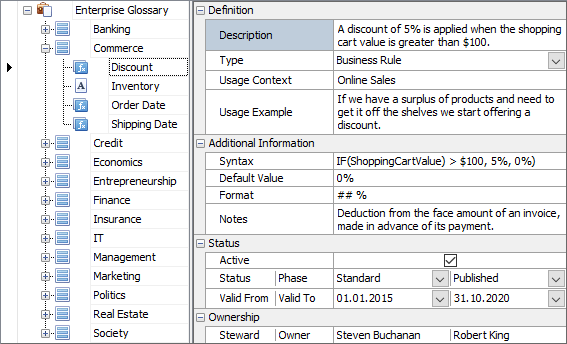
Business Glossary helps to maximize understanding of business concepts, terms and rules to achieve a single version of truth. It helps all parts of the business to better understand data’s context and usage.
20 new property fields have been added to better manage a common business vocabulary and make it available across an organization.
Data Mapping
Data Mapping is a process used in data integration by which different data models are linked to each other using a defined set of methods to characterize the data in a specific definition.
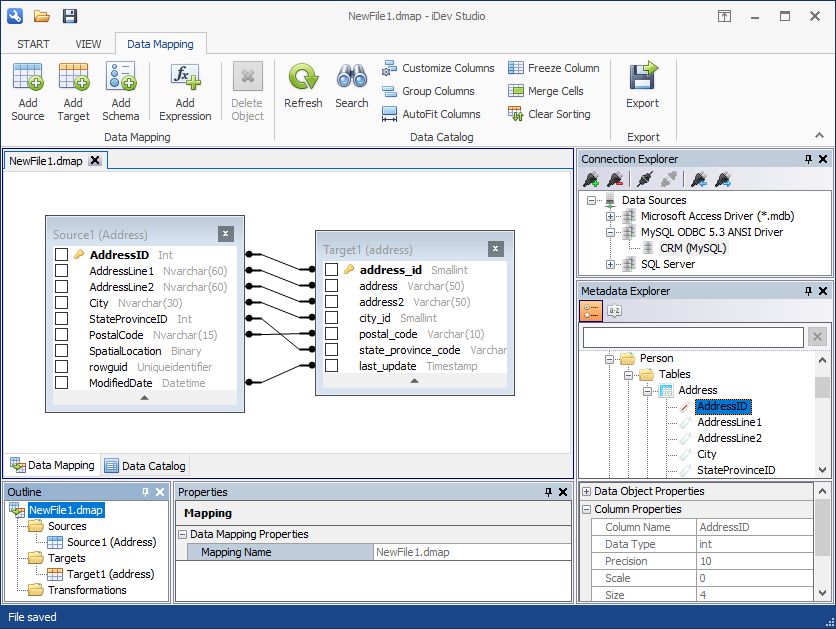
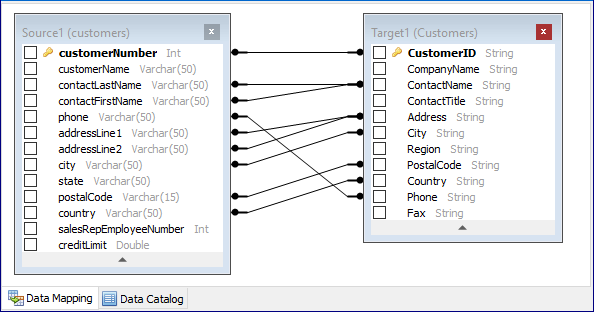
Visual Data Mapping Technology shows metadata and linking information to give you unprecedented data mapping capabilities. Dimensional, Relational or Data Vault Modeling – any integration scenario can be visualized and mapped. Column Auto-Linking automatically connects ports between identical source and target columns.
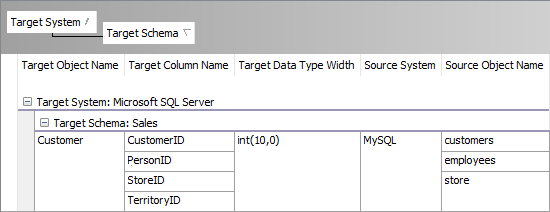
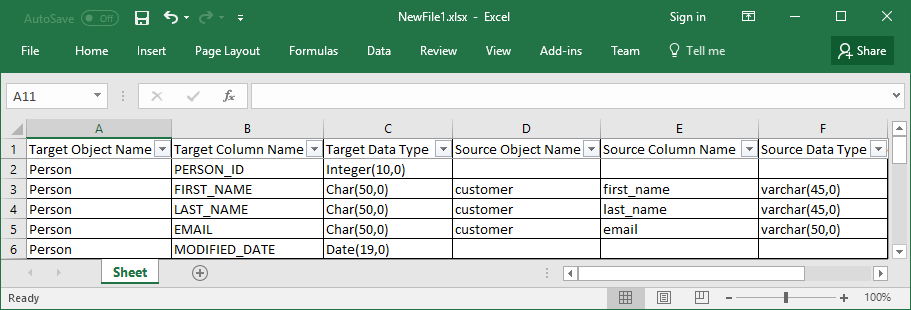
The new Data Catalog provides a revolutionary new way to create comprehensive specifications. Specifications are automatically generated. You can customize the column order, build a hierarchy by grouping and sorting columns, merge cells for better readability or freeze a column to navigate easier.
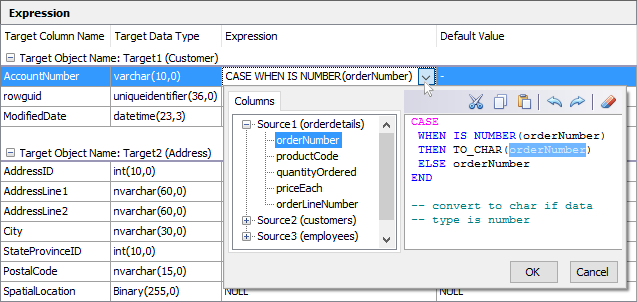
The new Expression Editor has been redesigned to enable you to manage all business rules in one central place. The built-in editor with syntax highlighting and source column reference allow you to transform business context into powerful transformation rules.
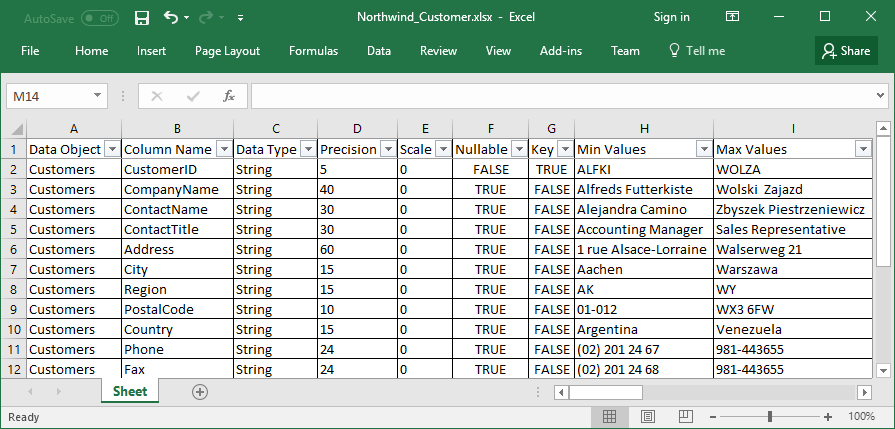
Data mapping can be exported as Excel Workbook (*.xlsx), Excel 97-2003 Workbook (*.xls), CSV (Comma delimited) (*.csv) and Formatted Text (Space delimited) (*.txt).
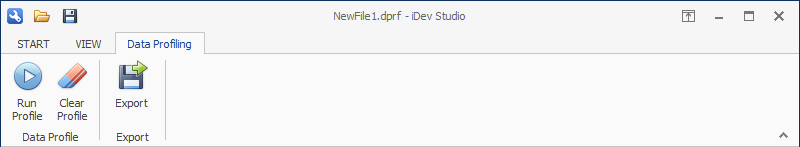
Data Profiling
Data Profiling is the process of reviewing source data, understanding structure, content and interrelationships, and identifying potential for data initiatives.
Data Profiling can’t get any easier than using a simple 3 step approach:
1 – Discover Metadata
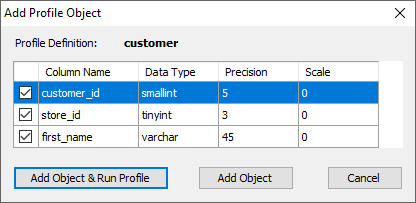
2 – Select Data Object and Columns
3 – Run Data Profiling
Column Analysis helps to discover metadata information, minimum and maximum value, plus column length distribution.
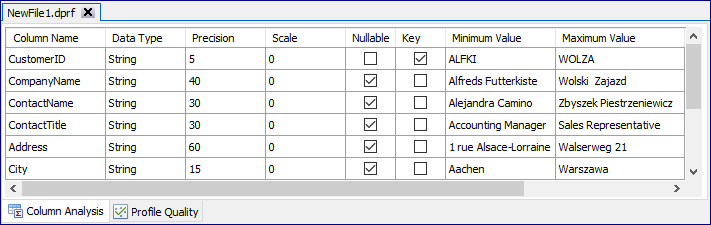
Profile Quality enables to measure the amount and percentage of nullable, duplicates, distinct, unique & non-unique values.
Data profiling results can be exported as Excel Workbook (*.xlsx), Excel 97-2003 Workbook (*.xls), CSV (Comma delimited) (*.csv) and Formatted Text (Space delimited) (*.txt).